The Antarctica Seven-Station Temperature Record
(1958–2025)
A direct look at the seven Antarctic station temperature record
from 1958 to 2025.
Project Purpose
This page looks only at the seven-station observational temperature average. The goal is to examine the long-term pattern in the station data itself, without comparing it to any other dataset.
The Seven Stations
The seven stations used in this project are:
- South Pole
- Mawson
- Vostok
- Byrd
- McMurdo
- Rothera
- Dumont d'Urville
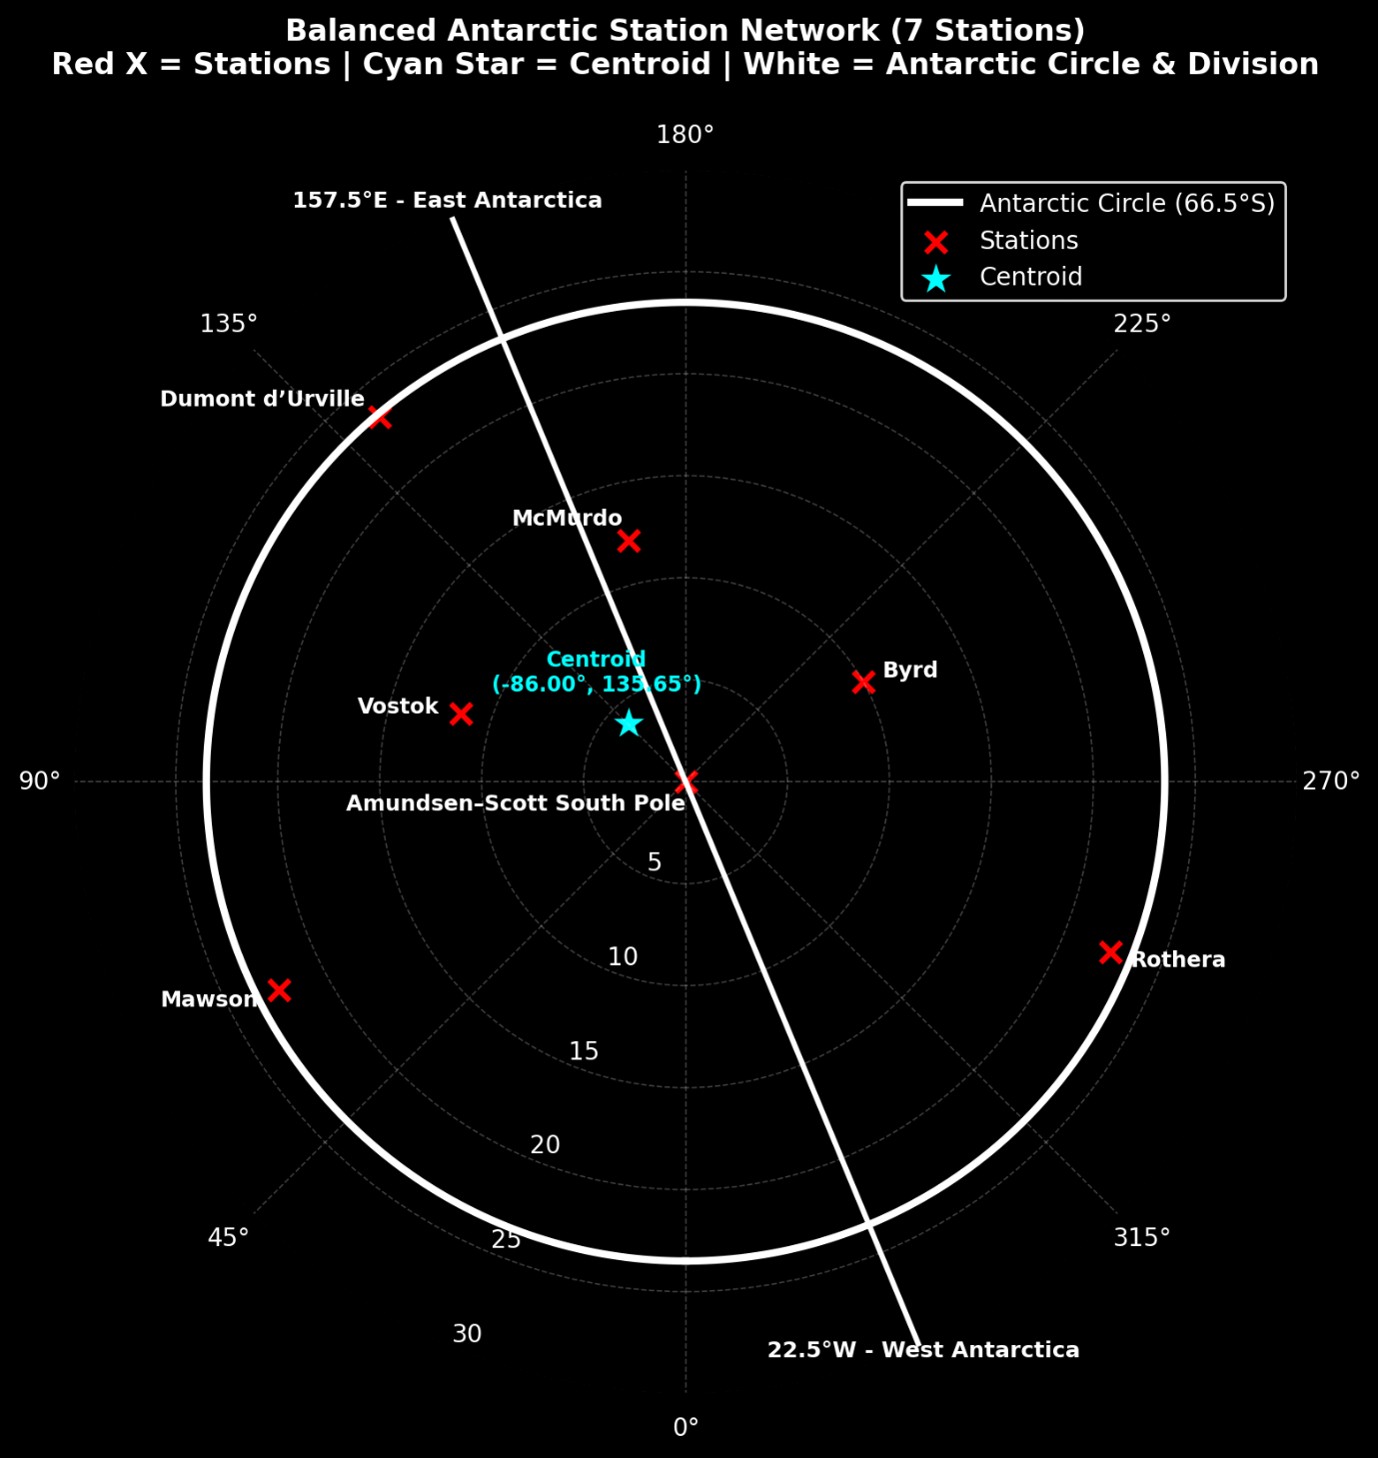
Balanced Antarctic station network used for the seven-station observational average.
Time Period
The full seven-station record begins in 1958 and currently runs through 2025. To look for a possible change in pattern, the data is divided into two sections: 1958–2006 and 2007–2025.
Trend Results
| Period | Seven-Station Trend |
|---|---|
| 1958–2006 | +0.183 °C/decade |
| 2007–2025 | −0.037 °C/decade |
From 1958 to 2006, the seven-station observational average shows a warming trend of approximately +0.183 °C per decade.
From 2007 to 2025, the same seven-station average shows a slight cooling trend of approximately −0.037 °C per decade.
1958–2006 Station Trend
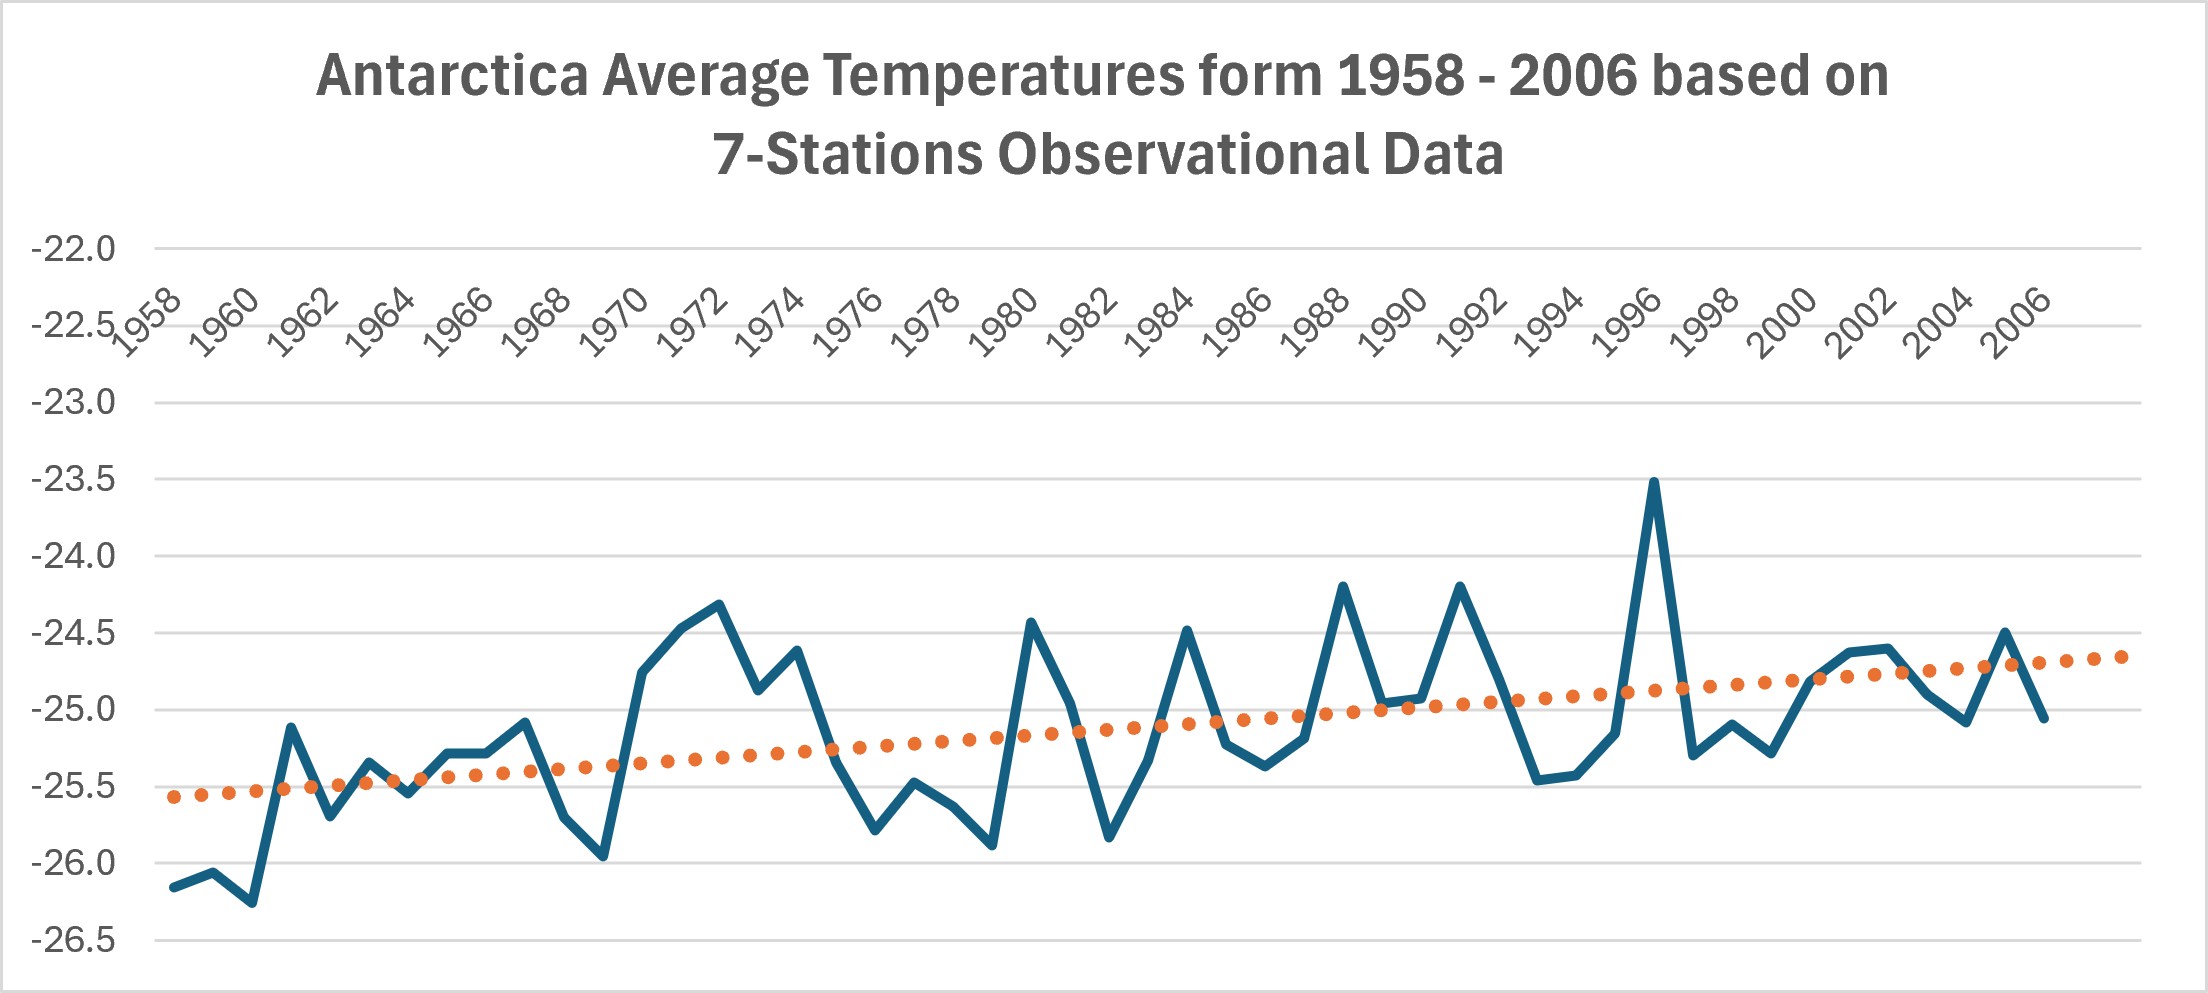
Seven-station observational temperature trend from 1958 to 2006.
2007–2025 Station Trend
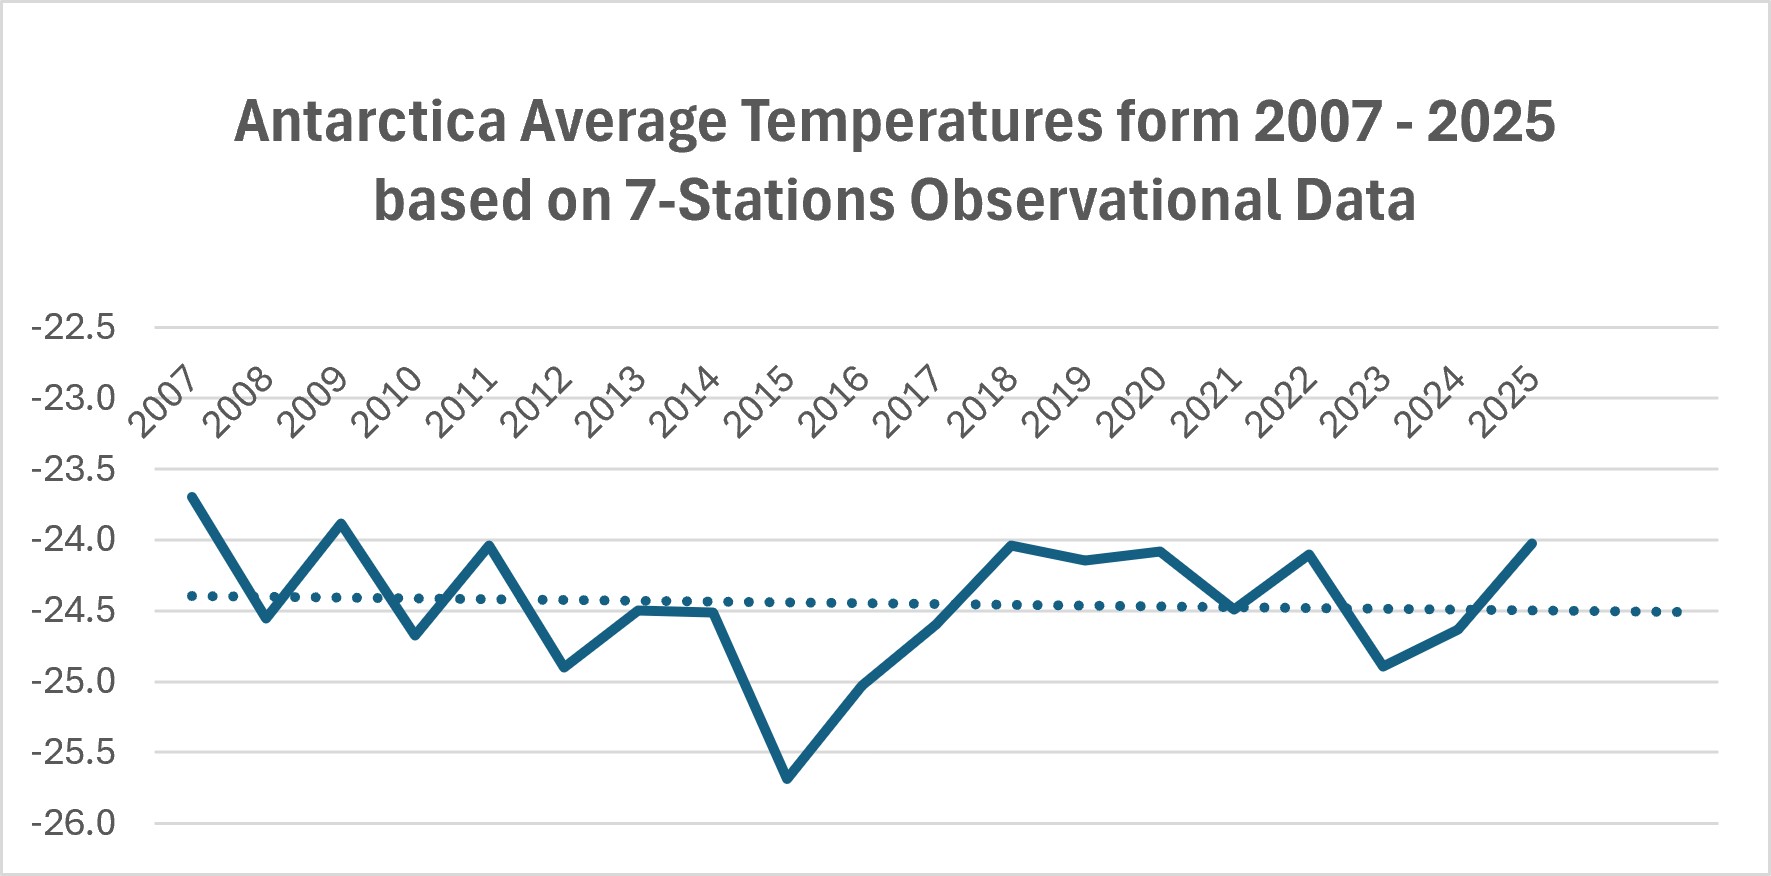
Seven-station observational temperature trend from 2007 to 2025.
Research Question
The facts are simple: the seven-station record shows warming from 1958 to 2006, followed by a slight cooling trend from 2007 to 2025. The recent period is still relatively short, so the next ten years will be important. If the 2007–2025 pattern continues, it may become a much stronger signal over time.
These results are based solely on the seven-station observational dataset. Continued observations over the coming years will determine whether the post-2007 pattern persists or changes.